UV-3600i Plus - Características
UV-VIS-NIR Spectrophotometer
Perfect for a Wide Variety of User Applications
Spectral evaluation functionality enables unique pass/fail judgments for quality control. During measurements, data can be automatically sent to Excel in real time for using macros to automatically obtain desired values.
| Electrical, Electronics, and Optics | Chemicals |
|---|---|
| High-absorbance measurement of polarizing films Reflection measurement of multilayer films Absolute reflectance measurement of highly reflective mirrors Spectral characteristic measurement of beam splitters Relative emission measurement of LEDs Transmittance measurement of quartz plates Absolute reflectance measurement of anti-reflection coatings Transmittance measurement of functional films Diffuse reflectance measurement and band gap measurement of semiconductor materials Transmittance measurement of solar cell cover glass, etc. |
Transmittance and color measurements of plastic materials Reflectance measurement of silica-based white powered materials Thickness measurement of thin films Near-infrared measurement of organic solvents Haze measurement of Plastics |
| Pharmaceuticals, Cosmetics, and Life Sciences | Foods |
|---|---|
| Cosmetic color measurement and ultraviolet screening measurement Measurement of drugs containing crystallization water Measurement of moisture in plants Measurement of various amino acids Quantitation of proteins and nucleic acids Near-infrared measurement of pharmaceutical components |
Diffuse reflectance measurement of wheat flour Quantitation of vitamins, food additives, and minerals Quantitation of phenol elution in containers and packaging materials |
| Construction / Transportation Equipment | Textiles |
|---|---|
| Transmittance measurement of window glass and window glass films Reflectance measurement of paints and building materials LiDAR collision avoidance sensor evaluation system |
Transmittance and reflectance measurements and ultraviolet screening measurement of textiles Color measurement of textiles |
Highest Sensitivity in Class with Three Detectors
Relationship between Detectors and Measurable Range

Switching between the photomultiplier tube and the InGaAs detector is possible in the range of 700 to 1,000 nm (the default switchover wavelength is 830 nm). Switching between the InGaAs detector and the PbS detector is possible in the range of 1,600 to 1,800 nm (the default switchover wavelength is 1,650 nm).
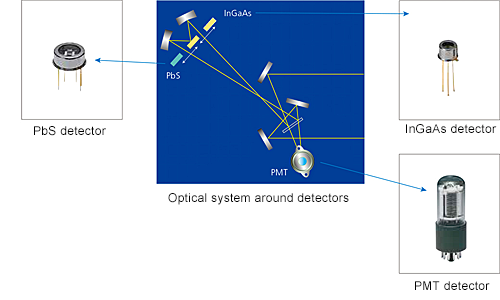
The UV-3600i Plus provides precise transmittance or reflectance measurements in the ultraviolet to near-infrared regions. The level of sensitivity in the near-infrared region is significantly enhanced by using the combination of an InGaAs detector and a cooled PbS detector for this region. Spectra can be obtained without interruption for the entire range, with a high level of sensitivity and precision.
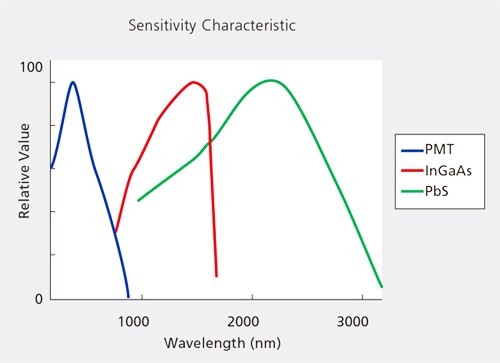
Some spectrophotometers use a PMT (photomultiplier tube) for the ultraviolet and visible region and a PbS detector for the near-infrared region. Neither detector, however, is very sensitive near the detector-switchover region. This prevents high-sensitivity measurement in this range. The UV-3600i Plus makes it possible to take high-sensitivity measurements in the switchover range by using an InGaAs detector.
High Resolution, Ultra-Low Stray Light, and Wide Measurement Wavelength Range
The UV-3600i Plus is equipped with a high-performance, grating-grating double monochromator, and achieves a low stray-light level with high resolution. The wavelength range is 185 to 3,300 nm. This instrument can perform spectrophotometry for various types of samples, ranging from those requiring high resolution, such as gas samples, to highly concentrated liquid samples.
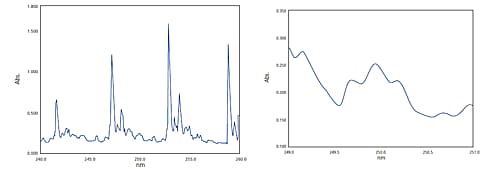
High-Resolution Spectra of Benzene Gas
The spectrum shown on the left was obtained by enclosing benzene gas in a cell with an optical-path length of 10 mm and performing measurement. The spectral bandwidth is 0.1 nm. The triplet in the neighborhood of 250 nm (enlarged on the right) can be clearly observed. This instrument allows high-resolution spectra to be measured with little noise.
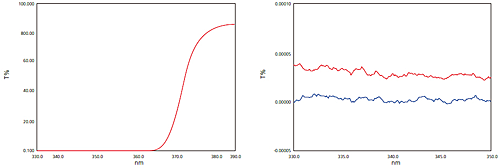
Ultra-Low Stray-Light Level of 0.00005 % Max. (340 nm)
The figure below on the left is a spectrum for aqueous NaNO2 solution, and the figure on the right shows an enlarged view of the neighborhood of 340 nm. In the figure on the right, the red spectrum is for aqueous NaNO2 solution and the blue spectrum is the 0 % line obtained when a shutter block is inserted on the sample-beam side. The UV-3600i Plus achieves an ultra-low stray-light level of less than 0.00005 % at 340 nm. (A mesh filter is used on the reference-beam side to maintain balance with the sample-beam side.)
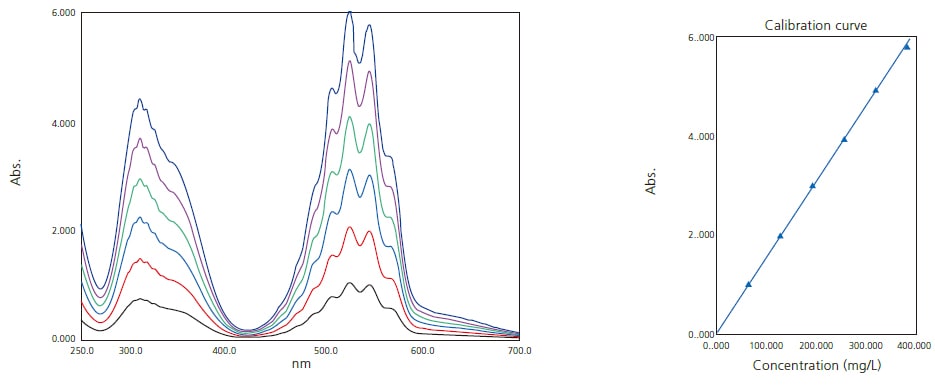
Linearity up to Absorbance Level 6
The figure on the left shows spectra obtained by measuring aqueous KMnO4 solution at six concentration levels. A mesh filter was inserted on the reference-beam side and a differential method was used to perform measurement up to absorbance level 6. Using negative absorbance enables measurement with little noise, even at high absorbance levels. The figure on the right shows the calibration curve using peak absorbances in vicinity of 525nm for aqueous KMnO4 solution, and shows that linearity is maintained up to absorbance level 6.
Covers Wide Wavelength Range from Ultraviolet to Near-Infrared
The wavelength range of 185 to 3,300 nm enables measurement over the ultraviolet, visible, and near-infrared regions. In addition, the acquired spectra exhibit little noise across the entire range.
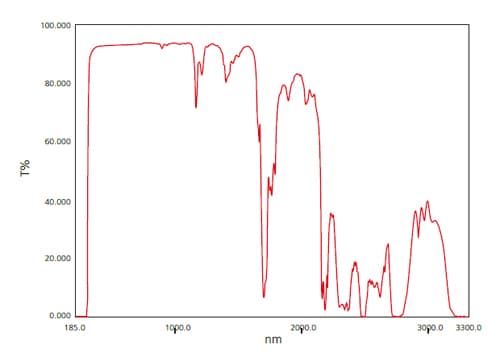
The figure on the right shows a spectrum obtained by measuring toluene in the range of 185 to 3,300 nm using a cell with an optical-path length of 2 mm.
Spectra in the ultraviolet, visible, and near-infrared regions can be obtained.


