UVProbe - Características
Multifunctional UV Control Software
UVProbe Features
Measurement modules with diverse data-processing and calculation functions
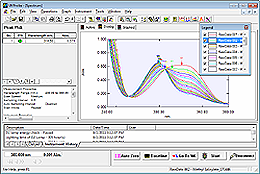
Kinetics measurement
A kinetics (time-course) measurement mode is available in addition to spectral and photometric (quantitative) modes. Comprehensive data-processing functions are provided for each mode.
Free-format report creation
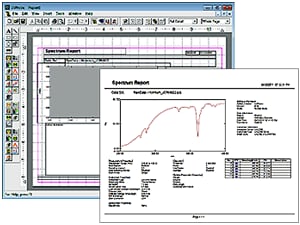
Free-format report creation
Reports can be created with a free layout of graphs and tables. The thickness and color of graph lines can be changed, and text and diagrams pasted. Finished layouts can be conveniently saved as templates.
GLP/GMP support functions
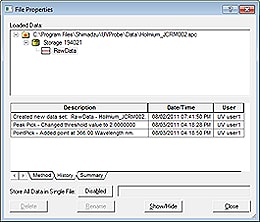
Audit-trail functions
Offers comprehensive GLP/GMP support functions, including security functions such as user authentication and authority settings, audit-trail functions for original acquired data and data processing history, and instrument log.
Connection to the optional LabSolutions system and CLASS-Agent software offer powerful support for FDA 21 CFR Part 11. Data acquired using UVProbe and calculated data can be automatically or manually registered for management in a database.
- Security functions
- When the security functions are enabled, an identification code and password are required when logging in. Advanced settings are available for the password. The functions assigned to each user can be restricted as well.
- Audit Trail Functions
- Data is stored in a file inside a directory structure. After calculations and other data processing based on original acquired data, the results are saved by creating new data inside the same file separate from the original data. The history log (user, date, operations) is also maintained inside this file.
- Data History Function
- Data is stored in a file inside a directory structure. After calculations and other data processing based on original acquired data, the results are saved by creating new data inside the same file separate from the original data. The history log (user, date, operations) is also maintained inside this file.
Comprehensive Data-Processing Functions
Spectrum Module
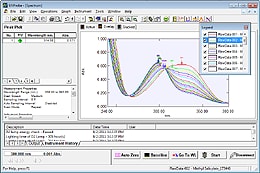
Spectrum Module
Compare data for multiple spectra, enlarge or reduce spectra, or add comments to the spectrum view. Peak (λ max) and trough (λ min) detection, area calculations, 1st to 4th derivatives, smoothing, reciprocal, square root, natural logarithm, Abs to %T conversion, exponential conversion, Kubelka-Munk conversion, ensemble averaging, interpolation, four arithmetic operations (between spectra / spectra and coefficients), etc.
Photometric (quantitative) module
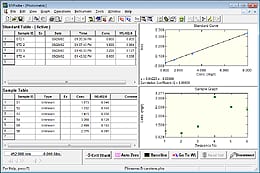
Photometric module
Offers quantitation with a single wavelength, multiple wavelength (includes 1, 2, and 3 wavelength methods), or spectrum (peak, maximum, area in specified wavelength ranges). Permits multi-point calibration (1st, 2nd and 3rd-order function fitting, pass-through-zero designation) and photometric processing with user-defined functions (combinations of +, -, ×, ÷, functions such as Log and Exp, and coefficients). Weight correction, dilution factor correction etc. with separate coefficients for each sample. Repeated measurements at designated intervals, data averaging, pass/fail evaluation based on measurement results with arbitrary evaluation expressions.
Kinetics Module
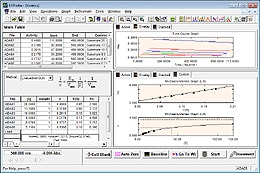
Kinetics module
Measures the changes in photometric values at two wavelengths over time (time-course measurement). Comparison, cross-processing, and registration of multiple time-course data. Enzyme activity calculation (single cell, multi-cell), Michaelis-Menten constant calculation and graph creation (supports Michaelis-Menten, Lineweaver-Burk, Hanes, Woolf, Eadie-Hofstee, and Hill plots), and recording of events such as reagent addition during measurements.


