IRXross - Características
Fourier Transform Infrared Spectrophotometer
High-End Sensitivity for Countless Applications
The IRXross is a mid-level FTIR model that achieves high-end level S/N. It enables best-in-class low noise with P-P values of 55,000:1 for one minute of integration.
Astoundingly Low Noise
The 100 %T line was obtained by successively measuring the background and sample values without placing a sample in the sample compartment. Excluding the peaks for water vapor and carbon dioxide, the noise level (P-P value) was within ±0.005 %T, which shows that it can acquire data with low noise.
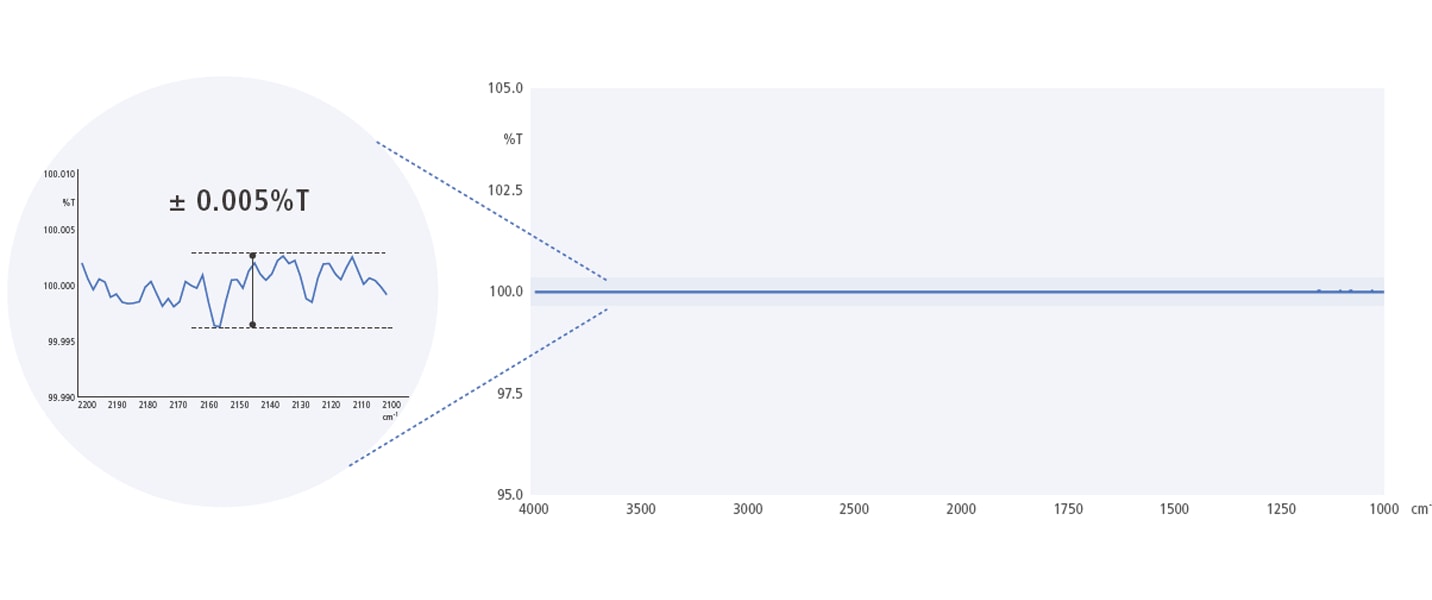
IRXross 100 %T Line
-
55,000:1 S/N Enables Ultra-High-Sensitivity Measurements
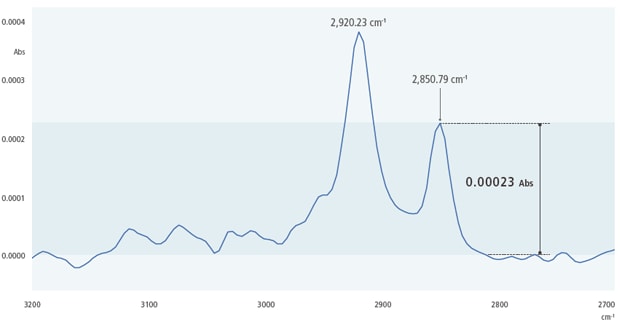
Using the IRXross with a single-reflection ATR attachment, an oil stain on paper was analyzed. Analyzing the sample directly without pretreatment would not result in good peaks, so n-hexane was applied to the stained area to extract the stain substances. Then a drop of the extract solution was placed on the ATR prism for analysis. The system is able to detect even the extremely weak 0.00023 absorbance signal with good sensitivity. -
-
0.25 cm-1 Resolution Enables High-Resolution Measurements
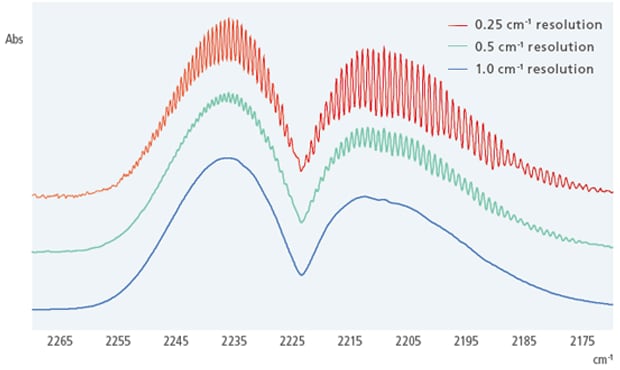
N2O gas (500 ppm), considered an environmental problem as a greenhouse gas, was analyzed. Measuring the gas at high resolution shows the peaks near 2,230 cm-1 properly separated, whereas a resolution of 1.0 cm-1 only shows the peaks as two levels. -
-
High-Speed Measurement Enables Faster Reaction Tracking
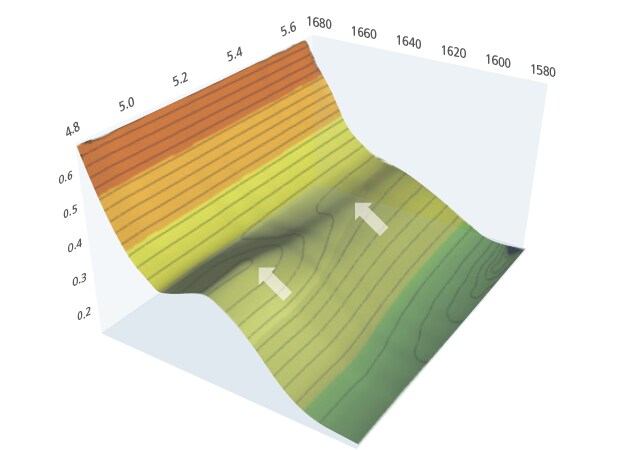
When tracking the curing reaction in UV curable resin, the data shows that the intensity of the peak at 1,635 cm-1 began decreasing 5.0 seconds after UV irradiation and the reaction was finished by 5.5 seconds. -
Built- in Analytical Intel l igence
-
Easy Navigation with IR Pilot™ Ensures Anyone Can Get Started Easily
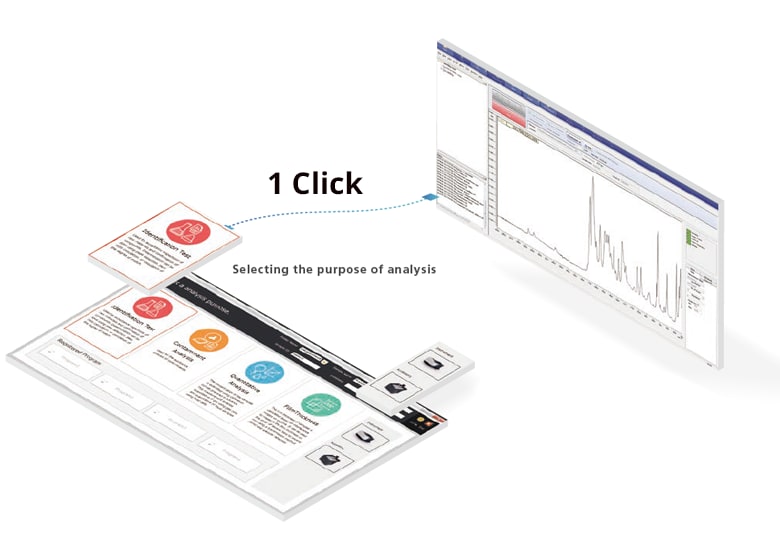
A total of 23 macro application programs are included. Even operators unfamiliar with FTIR analysis can analyze samples easily by simply selecting the purpose of analysis and attachment used. There is no need to set parameters. Multiple samples can be analyzed with a single click. -
-
Program Specifically for Supporting Identification Testing
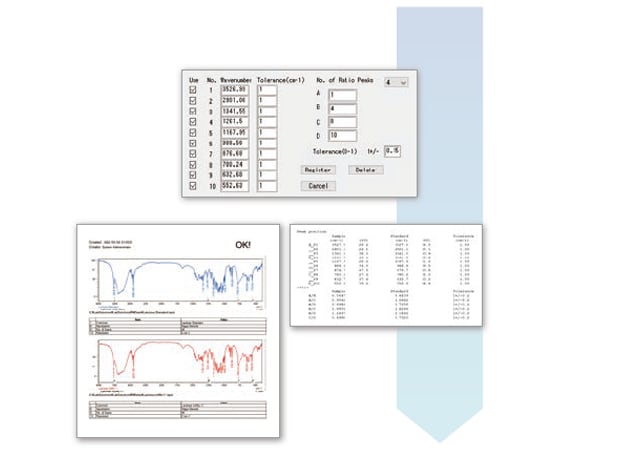
This program makes pass/fail judgments for test samples based on verification methods specified in pharmacopoeia and official methods specified in respective countries. In addition to identification tests for pharmaceuticals and food products, the program can be used for acceptance and pre-shipment inspections. It calculates how much peak wavenumbers and the intensity ratio between peaks in test samples differ from the corresponding values in standard samples and then makes pass/fail judgments. The results are printed as a report.
-
-
Program Specifically for Supporting Contaminant Analysis
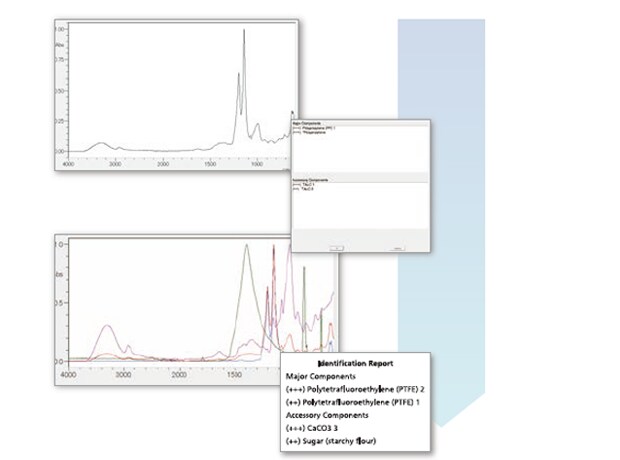
This program can accurately identify measured contaminants using Shimadzu’s proprietary algorithm (patent No. 5205918) in combination with a spectral library containing more than 550 spectra for substances commonly detected as contaminants. After analyzing the data, it automatically determines a pass/fail judgment and creates a report. Even for contaminants that are mixtures, the program searches possible principal and secondary components and indicates the certainty level of each substance identified. Because the number of components in the mixture does not need to be specified, even operators with minimal infrared analysis experience can easily analyze contaminants. It displays analysis results within a few seconds after selecting the spectrum. -
-
Library Useful for Identification Testing and Contaminant Analysis
Approx. 12,000-spectra library
A wide variety of libraries, including Shimadzu’s unique libraries, reagents, polymers, and more, is included standard. Searching with standard libraries provides high-quality search results without purchasing extra libraries. -
SHIMADZU
Food additives libraryReagents Pharmaceutical
products, agrichemicalsSHIMADZU
Contaminant libraryPolymers Inorganic compounds
Complies Fully with Regulations
Humidity-Resistant Window Material Compatible with the Wavenumber Measurement Range Specified in Pharmacopoeia
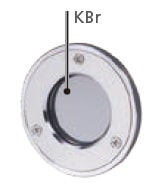
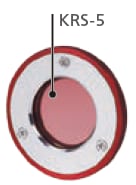
Either a KBr or KRS-5 window can be selected. The KRS-5 window maintains humidity resistance up to 90 %RH (for temperatures up to 30 °C) and is compliant with pharmacopoeia wavenumber range requirements (350 to 7,800 cm-1).
| KBr Window | KRS-5 Window | |
|---|---|---|
| Window Material |
 |
 |
| Humidity Resistance |
With humidity-resistant coating Max. humidity at installation site: 70 %RH (with no condensation) | Max. humidity at installation site: 90 %RH (provided no condensation at temperatures up to 30 °C) |
| Wavenumber Range |
350 to 7,800 cm-1 | |
| Transmittance | About 90 %T | About 70 %T |
| Characteristics | High transmittance and high sensitivity Could deliquesce in humid environments | Compared to KBr window: • Higher humidity-resistance • Lower S/N due to lower transmittance |
-
Internal Dehumidifier (Optional) Ensures High Durability
This dehumidifier removes moisture from inside the interferometer electrolytically using a solid polymer electrolytic membrane It maintains low humidity levels inside the interferometer without leaving the light source ON. Using the dehumidifier can reduce power consumption by about 90 % compared to leaving the light source illuminated. -
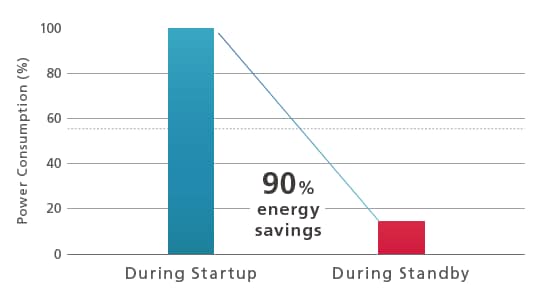
IRXross Power Consumption during Startup (with Start Switch ON) and during Standby (with Start Switch OFF and Dehumidifier ON)
Data Integrity Compliance
Solid Security
An audit trail to ensure the reliability of data and document e-mail transmission functions when any event occurs in the system can be set up. User accounts are managed using passwords, where password length, complexity, and term of validity must satisfy specified requirements. It is also possible to set lockout functions to prevent illegal access and set a registered user’s deletion and change in status. In addition, a box can be selected to prevent overwriting a data file, and outputting an item to a report can be performed.
-
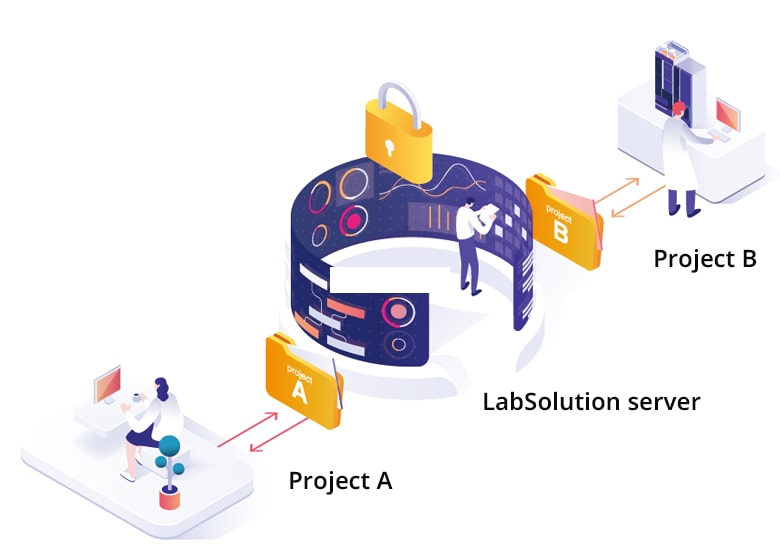
Essential Information is Managed for Every Project
LabSolutions DB IR and CS IR provide a project management function enabling management suited to tasks and system operations. This function enables equipment and user management, security policy, and data processing to be set on a project-by-project basis, thereby improving the efficiency of data searches and management tasks. -
Visualization of the Sequence of Analysis Operations
The report set includes test methods and test results for a series of samples analyzed as well as a corresponding operation log (a record of all operating events from login to logout), which is automatically extracted from the data and summarized in a single report. It provides visibility of the individual analytical operations, helps to check for operating errors, and improves the efficiency and reliability of checking processes.


